Every retailer knows that stock is the largest asset on the balance sheet. Yet many store owners are unsure how that stock should be valued. The method you pick directly changes your cost of goods sold (COGS), your gross profit, your tax liability and the numbers your lenders see.
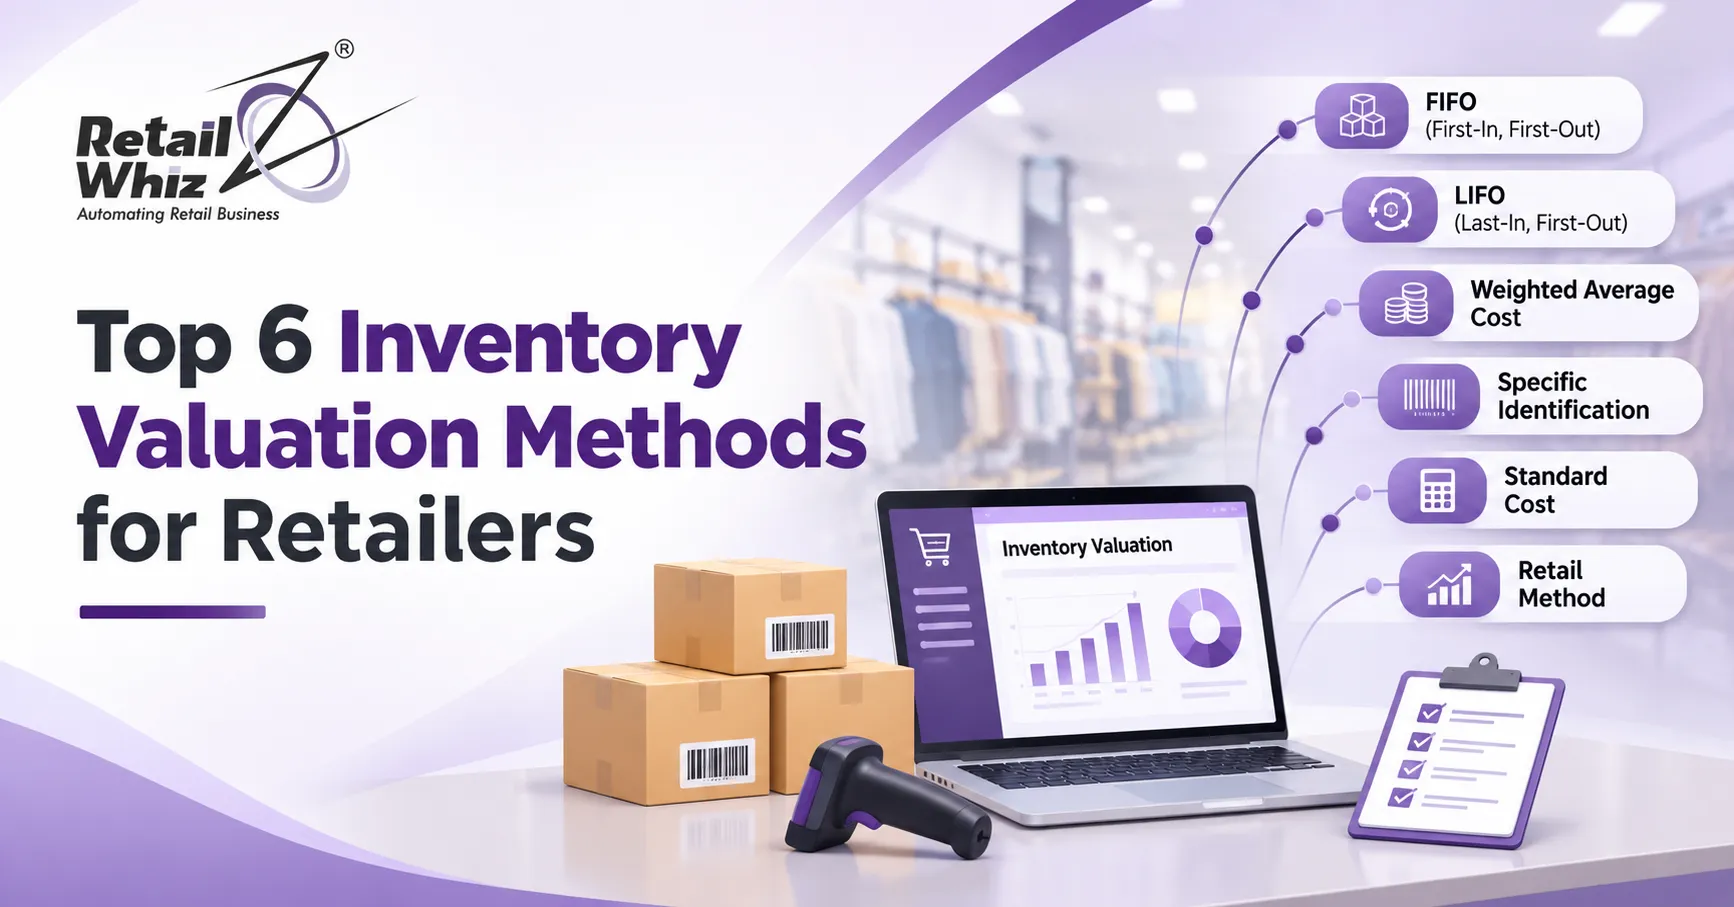
Choosing among the inventory valuation methods is not just an accounting exercise. It shapes pricing decisions, reorder planning and the overall health of your retail business. This guide explains the top 6 inventory valuation methods for retailers, with simple examples, pros, cons and tips on picking the right one.
What Is Inventory Valuation?
Inventory valuation is the process of assigning a monetary value to the stock you hold at the end of an accounting period. Because the purchase price of goods keeps changing, the same product can enter your store at different costs across the year. Your valuation method decides which cost is matched with the goods sold and which cost stays on the balance sheet as closing stock.
The basic inventory valuation formula is:
Cost of Goods Sold = Opening Inventory + Purchases − Closing Inventory
Since closing inventory sits inside this formula, any change in how you value it changes COGS and profit. That is why consistent, accurate stock valuation matters so much.
Why Inventory Valuation Matters for Retailers
- Accurate profit reporting: Wrong stock values lead to wrong profit figures.
- Better tax planning: Closing stock affects taxable income.
- Smarter purchasing: Knowing the true value of stock helps you avoid overstocking and dead stock.
- Loan and investor readiness: Banks review inventory values when assessing working capital limits.
- Audit and compliance: Consistent methods make audits smoother and reduce disputes.
Retailers with modern inventory management software can track purchase costs, batches and stock movement in real time, which makes any valuation method far easier to apply and verify.
The Top 6 Inventory Valuation Methods for Retailers
To compare the methods fairly, we will use one running example. Suppose a store buys 100 units at ₹50, then another 100 units at ₹60, and later sells 150 units.
1. FIFO (First In, First Out)
FIFO assumes the oldest stock is sold first. The earliest purchase costs flow into COGS, and the most recent costs remain in closing inventory.
Example:
- COGS: (100 × ₹50) + (50 × ₹60) = ₹5,000 + ₹3,000 = ₹8,000
- Closing inventory: 50 × ₹60 = ₹3,000
Pros:
- Matches the real physical flow of goods in most stores, especially for perishables, groceries, medicines and packaged foods.
- Closing stock reflects recent market prices, so the balance sheet looks realistic.
- Widely accepted and easy to audit.
Cons:
- In periods of rising prices, COGS looks lower and profit looks higher, which can increase tax.
Best for: Supermarkets, pharmacies, bakeries, FMCG distributors and any retailer selling products with expiry dates.
2. LIFO (Last In, First Out)
LIFO assumes the newest stock is sold first. The latest purchase costs go into COGS, and the oldest costs stay in closing inventory.
Example:
- COGS: (100 × ₹60) + (50 × ₹50) = ₹6,000 + ₹2,500 = ₹8,500
- Closing inventory: 50 × ₹50 = ₹2,500
Pros:
- In inflationary markets, higher COGS reduces reported profit and can lower tax in jurisdictions where it is allowed.
- Matches current costs against current revenue.
Cons:
- Closing stock can be valued at very old, outdated prices.
- It is not permitted under IFRS or Ind AS 2, so it is generally not acceptable for Indian retailers following Indian accounting standards.
Best for: Mostly relevant in the United States under US GAAP. When comparing FIFO vs LIFO, Indian retailers should remember that FIFO is the practical and compliant choice.
3. Weighted Average Cost Method
The weighted average cost (WAC) method spreads the total cost of goods available for sale evenly across all units. You divide the total cost by the total number of units to get an average cost per unit.
Example:
- Average cost: (₹5,000 + ₹6,000) ÷ 200 units = ₹55 per unit
- COGS: 150 × ₹55 = ₹8,250
- Closing inventory: 50 × ₹55 = ₹2,750
Pros:
- Smooths out price swings, so profit does not jump around with each purchase.
- Simple to apply for products that are identical and interchangeable, such as rice, sugar, cooking oil or stationery.
- Accepted under Indian accounting standards.
Cons:
- The average needs recalculation after every purchase, which is painful in a manual system.
- It does not reflect the exact cost of any specific batch.
Best for: Grocery stores, hardware shops, general retail and any business selling high volumes of similar items.
4. Specific Identification Method
Under this method, every item is tracked individually, and its exact purchase cost is matched with its sale. No assumptions are made about cost flow.
Example: A jeweller buys a diamond ring for ₹80,000 and another for ₹95,000. When the ₹95,000 ring is sold, exactly ₹95,000 goes to COGS.
Pros:
- Highest possible accuracy.
- Perfect for unique, high value products.
Cons:
- Impractical for stores with thousands of low value SKUs.
- Needs serial numbers, tags or detailed batch tracking.
Best for: Jewellery stores, luxury watches, art, antiques, vehicles, premium electronics and custom furniture.
5. Retail Inventory Method
The retail inventory method estimates the cost of closing stock using the relationship between cost and selling price. It is very popular with large retailers, because counting and costing every item at year end is time consuming.
Steps:
- Calculate the cost to retail ratio: Cost of goods available ÷ Retail value of goods available.
- Subtract sales from the retail value of goods available to get closing stock at retail.
- Multiply closing stock at retail by the cost ratio to get closing stock at cost.
Example:
- Goods available at cost: ₹4,00,000
- Goods available at retail: ₹6,00,000
- Cost ratio: ₹4,00,000 ÷ ₹6,00,000 = 66.67%
- Sales for the period: ₹4,50,000
- Closing stock at retail: ₹6,00,000 − ₹4,50,000 = ₹1,50,000
- Closing stock at cost: ₹1,50,000 × 66.67% = about ₹1,00,000
Pros:
- Fast and practical for departmental stores, supermarkets and fashion chains with a large number of items.
- Works well with standard markup structures.
- Helpful for interim reporting without a full physical count.
Cons:
- It is an estimate, so markdowns, discounts and mixed margin categories can distort the results.
- It needs reliable category level data.
Best for: Department stores, hypermarkets, apparel chains and multi-category retailers.
6. Gross Profit Method
The gross profit method estimates closing inventory using your historical gross margin percentage. It is commonly used when stock records are lost, when a fire or theft occurs, or when you need a monthly estimate without a physical count.
Example:
- Opening inventory: ₹2,00,000
- Purchases: ₹6,00,000
- Sales: ₹9,00,000
- Historical gross margin: 30%
- Estimated COGS: ₹9,00,000 × 70% = ₹6,30,000
- Goods available for sale: ₹8,00,000
- Estimated closing inventory: ₹8,00,000 − ₹6,30,000 = ₹1,70,000
Pros:
- Quick, simple and useful for insurance claims and monthly management reports.
- No physical count required.
Cons:
- Only an estimate, and usually not accepted for final annual financial statements.
- Accuracy drops if margins or product mix change.
Best for: Interim reporting, loss estimation and quick sanity checks on stock records.
Quick Comparison of Inventory Valuation Methods
| Method | Accuracy | Complexity | Best For | Allowed Under Ind AS 2 |
| FIFO | High | Low | Perishables, FMCG, pharmacy | Yes |
| LIFO | Medium | Medium | US based businesses | No |
| Weighted Average | Medium | Medium | Interchangeable goods | Yes |
| Specific Identification | Very high | High | Unique, high value items | Yes |
| Retail Method | Medium | Medium | Large multi-category retailers | Yes (as a technique) |
| Gross Profit Method | Low | Low | Estimates and interim reports | Not for final reporting |
How to Choose the Right Inventory Valuation Method
Use these questions to narrow down your choice:
- What do you sell? Perishable goods suit FIFO. Unique items suit specific identification. Bulk, identical goods suit weighted average.
- How large is your SKU count? Thousands of items make the retail method or an automated FIFO or weighted average setup more realistic.
- Which accounting standard do you follow? Indian retailers should lean towards FIFO or weighted average, as LIFO is not permitted.
- How volatile are your purchase prices? Highly volatile prices make weighted average attractive because it smooths results.
- Do you need consistency? Once you choose a method, apply it consistently. Frequent changes raise audit questions.
Compliance also plays a role here. Your closing stock affects GST input credit reconciliation, profit and income tax filings, so aligning your valuation with robust GST and compliance tools helps you avoid mismatches during filing.
Common Inventory Valuation Mistakes Retailers Make
- Ignoring shrinkage: Theft, damage and expiry reduce real stock value, but many records do not reflect it.
- Skipping regular stock counts: Without cycle counts or physical audits, book stock drifts away from reality.
- Mixing methods: Using FIFO for some categories and weighted average for others, without a clear policy, creates reporting confusion.
- Not writing down obsolete stock: Stock should be valued at the lower of cost and net realisable value. Slow moving or damaged items need adjustments.
- Relying on spreadsheets: Manual sheets create version errors and delay month end closing.
How Technology Makes Inventory Valuation Easier
Applying FIFO or weighted average cost by hand across thousands of products is slow and error prone. A modern retail ERP does this automatically. Every purchase, sale, return and transfer updates cost and quantity in real time. Batch and expiry tracking supports FIFO. Automatic average cost recalculation supports the weighted average method. Reports on fast moving items, dead stock and stock valuation give you instant clarity.
If you are comparing tools to run your finances alongside stock, our breakdown of the top accounting software for retailers can help you see what features matter most. Retailers planning a switch from manual or legacy systems should also consider a structured retail ERP implementation so that opening stock values, cost layers and valuation settings are configured correctly from day one.
Final Thoughts
There is no single best method among the inventory valuation methods. FIFO is the safest and most intuitive choice for most Indian retailers. Weighted average works beautifully for identical, high volume goods. Specific identification is ideal for premium, unique items. The retail inventory method and gross profit method are valuable estimation tools for larger or time pressed businesses, while LIFO remains mostly a US concept.
Whichever method you choose, apply it consistently, keep your stock data accurate and let software handle the heavy calculations. Accurate stock valuation protects your margins, strengthens your financial reporting and gives you the confidence to grow.
Frequently Asked Questions (FAQs)
1. Which inventory valuation method is best for retailers?
FIFO is the most popular and practical option for most retailers, especially those dealing with perishable or date sensitive goods. Weighted average is a strong alternative for stores with large volumes of identical products. The best choice depends on your product type, SKU count and the accounting standards you follow.
2. Is LIFO allowed in India?
No. LIFO is not permitted under Ind AS 2 or IFRS, so Indian businesses following these standards cannot use it for financial reporting. Retailers in India should use FIFO or the weighted average cost method.
3. What is the difference between FIFO and weighted average cost?
FIFO assigns the cost of the oldest purchases to goods sold first, leaving recent costs in closing stock. Weighted average cost blends all purchase costs into a single average per unit. FIFO reflects the physical flow of goods more closely, while weighted average smooths out price fluctuations.
4. How does inventory valuation affect profit and tax?
Closing inventory is part of the COGS formula, so a higher closing stock value reduces COGS and increases gross profit and taxable income. A lower closing stock value does the opposite. This is why the method you choose, and applying it consistently, has a direct impact on reported profit and tax.
5. Can inventory management software automate inventory valuation?
Yes. Modern inventory management and retail ERP software track purchase cost, batch, expiry and stock movement in real time. They automatically calculate COGS and closing stock value using methods such as FIFO or weighted average, which reduces manual errors and speeds up month end reporting.