Running a retail store without tracking the right numbers is like driving with your eyes closed. You might get lucky for a while, but sooner or later you will hit a wall. That is exactly why a retail KPI dashboard has become the backbone of modern retail management. It gives store owners a real time, single view of how their business is actually performing, instead of relying on gut feeling or end of month guesswork.
Whether you run one store or a chain of fifty, the difference between a thriving retailer and a struggling one often comes down to how closely they monitor their daily retail metrics through a properly configured dashboard. In this guide, we will break down the essential key performance indicators every store owner should track every single day, why they matter, and how a well built retail dashboard can transform decision making across your business.
What Is a Retail KPI Dashboard
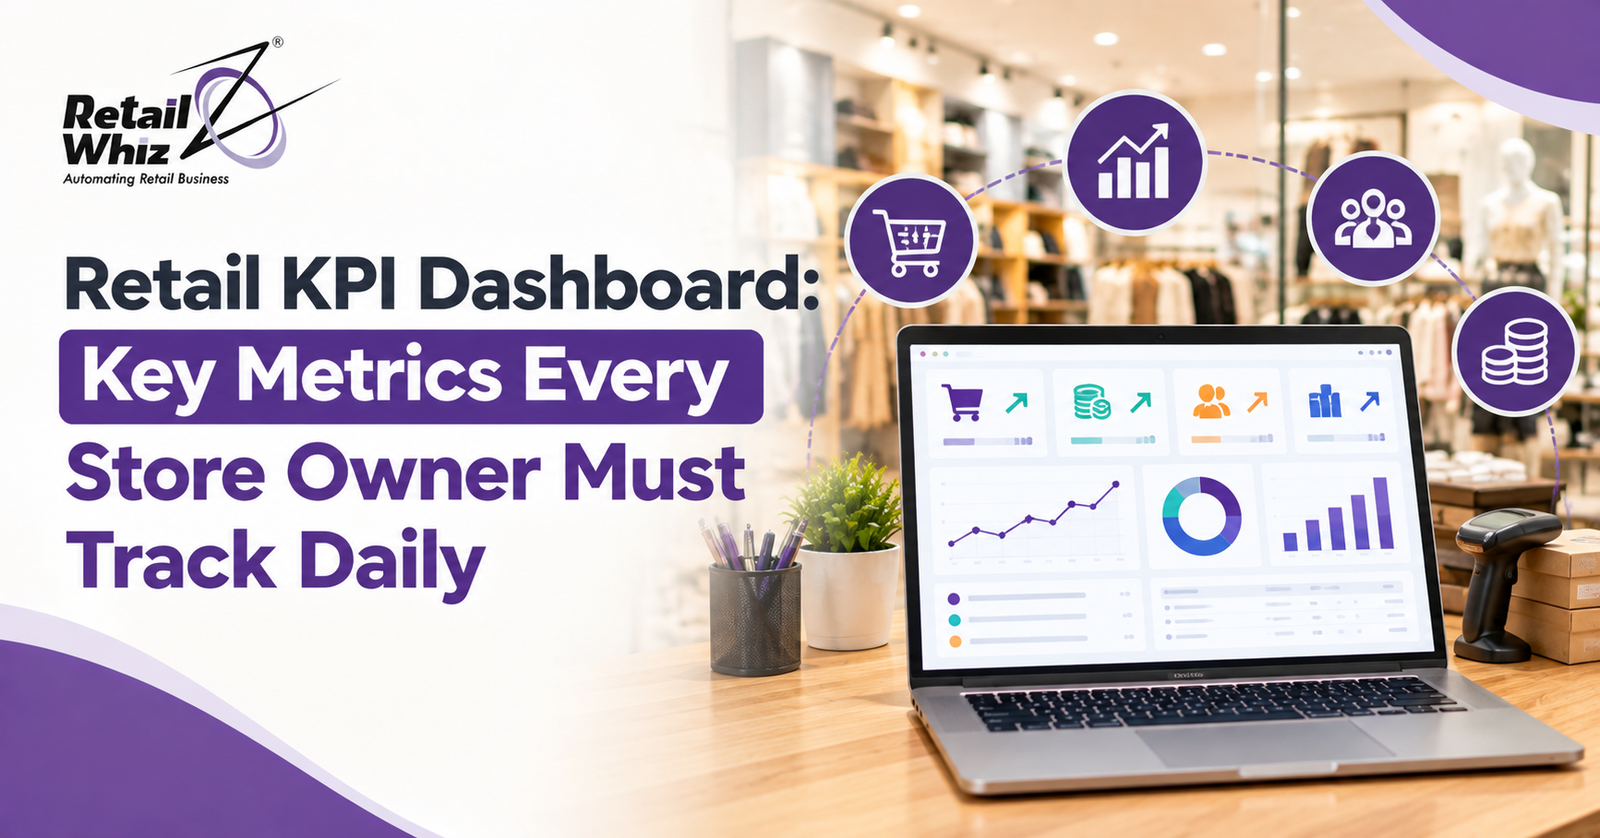
A retail KPI dashboard is a centralized reporting tool that pulls data from your point of sale system, inventory records, staff schedules, and customer database, then displays it in an easy to read format.
A good retail performance dashboard typically helps you:
- See sales trends, stock levels, footfall, and profitability at a glance
- Skip manual report pulling from disconnected systems
- Spot patterns and flag anomalies before they become losses
- Take corrective action quickly instead of reacting after the damage is done
For growing retail businesses, this kind of visibility is no longer optional, it is essential for staying competitive in a market where margins are thin and customer expectations are high.
Why Daily KPI Tracking Matters for Retailers
Many retailers still rely on weekly or monthly reviews, but retail is a fast moving environment. A slow selling product, a cash mismatch, or a staffing gap can quietly drain profits for weeks before anyone notices. Daily tracking through a retail KPI dashboard helps you catch these issues immediately.
Daily monitoring also supports better forecasting. When you know your average daily sales, footfall patterns, and stock movement, you can:
- Plan promotions with confidence instead of guesswork
- Schedule staff around actual demand patterns
- Time purchase orders more accurately
- React quickly to seasonal or local demand shifts
This is particularly important for supermarkets, grocery stores, apparel outlets, and pharmacy chains where demand can shift quickly based on season, location, and local events.
Key Retail Metrics Every Store Owner Must Track Daily
1. Total Sales Revenue
This is the most obvious yet most important metric on any retail sales dashboard. Tracking daily sales revenue against your targets tells you immediately whether the store is on pace to meet monthly goals.
- Break it down by category, brand, or department
- Compare against the same day last week or last month
- Watch for sudden dips that need same-day investigation
2. Average Transaction Value
Also known as average basket size, this metric shows how much each customer spends per visit.
- A declining average transaction value can signal weak upselling
- It can also point to poor product placement or reduced customer confidence
- Test promotions or bundle offers and track the impact daily
3. Foot Traffic and Conversion Rate
Foot traffic tells you how many people entered your store, while conversion rate tells you what percentage of them actually made a purchase.
- High footfall with low conversion often signals staff engagement issues
- It can also point to poor product availability or store layout problems
- Tracking both together reveals far more than either metric alone
4. Sales Per Square Foot
This metric measures how efficiently your retail space is generating revenue.
- Useful for comparing performance across multiple store locations
- Helps decide which categories deserve more shelf space
- Flags underperforming sections relative to the space they occupy
5. Inventory Turnover Ratio
Inventory turnover shows how quickly stock is sold and replaced over a given period.
- A low turnover ratio usually means overstocking or dead stock
- An extremely high ratio might indicate frequent stockouts
- Especially critical for fast moving consumer goods and perishables
6. Stock Availability and Out of Stock Rate
Nothing frustrates a customer more than walking in for a specific product and finding it unavailable.
- Track out of stock rate daily to catch gaps early
- Set automatic low stock alerts for popular items
- Replenish fast movers before they fully run out
7. Gross Profit Margin
While revenue tells you how much you are selling, gross profit margin tells you how much you are actually keeping.
- Track margin daily across different product categories
- Watch for discounting that is eating into profitability
- Monitor supplier cost increases that quietly shrink margins
8. Shrinkage Rate
Shrinkage, caused by theft, damage, or administrative errors, is one of the biggest silent profit killers in retail.
- Daily tracking helps spot unusual patterns early
- Identify if a specific product category is affected
- Check if a particular shift or location needs closer attention
9. Employee Productivity and Sales Per Employee
This metric measures how much revenue each staff member generates during their shift.
- Helps identify top performers and training needs
- Informs smarter scheduling decisions
- Reveals operational gaps when compared across multiple outlets
10. Customer Retention and Repeat Purchase Rate
Acquiring a new customer costs significantly more than retaining an existing one.
- Track repeat purchase rate to gauge loyalty program effectiveness
- Watch overall customer retention trends week over week
- Treat a sudden dip as an early warning sign of service issues
11. Cash Flow and Daily Cash Reconciliation
For store owners, daily cash reconciliation is not just an accounting task, it is a critical control metric.
- Compare expected cash based on sales data against actual collections
- Investigate discrepancies the same day, not weeks later
- Use this as a check against both errors and fraud
How a Retail Dashboard Simplifies KPI Tracking
Manually compiling all these metrics from spreadsheets and disconnected systems is time consuming and prone to error. A modern retail ERP software solution automates this entire process by pulling live data directly from your point of sale, inventory, and accounting modules into one unified retail dashboard.
This is where an integrated retail management system becomes invaluable. Instead of juggling multiple reports, store owners get a single source of truth that updates in real time, enabling faster and more confident decision making. If you are exploring how to bring your inventory, sales, and reporting systems onto one reliable platform, our retail ERP software is built specifically for supermarkets, grocery stores, apparel outlets, and pharmacy chains that need accurate, real time visibility into daily operations.
Choosing the Right KPIs for Your Business
Not every retailer needs to track all of the above metrics with equal intensity:
- A grocery store dealing with perishable inventory will prioritize stock turnover and out of stock rates
- An apparel retailer might focus more on average transaction value and sales per square foot
- A pharmacy chain may weigh shrinkage and stock availability more heavily than footfall
The key is to start with the metrics most closely tied to your specific business goals and expand your dashboard as your reporting needs mature.
It also helps to review your KPI dashboard structure periodically. As your business grows, whether through new store locations, additional product categories, or an expanded customer base, your reporting data itself often needs to be reorganized or migrated to a more scalable system. If you are upgrading your systems or consolidating data from multiple sources, our retail data migration services ensure your historical sales, inventory, and customer data move over accurately without disrupting daily operations.
Common Mistakes Store Owners Make With KPI Tracking
- Tracking too many numbers without acting on any of them
- Reviewing the dashboard inconsistently instead of daily
- Treating KPIs in isolation instead of spotting connections between them, like footfall and conversion, or shrinkage and staff scheduling
- Relying on outdated or manually updated data instead of a live, connected system
Real time data integration is what separates a genuinely useful dashboard from a static report that nobody trusts.
Building a Daily KPI Review Habit
Tracking metrics is only half the job. The real value comes from building a consistent daily review habit. Successful store owners typically start their day by checking a handful of core numbers:
- Sales versus target
- Stock alerts and out of stock items
- Cash reconciliation
From there, they dive deeper into specific categories or locations as needed. Over time, this daily discipline creates a feedback loop, helping you notice which days of the week need more staff, which products need reordering earlier, and which promotions actually move the needle on revenue.
Final Thoughts
A well designed retail KPI dashboard is not just a reporting tool, it is a decision making engine for your business. By consistently tracking metrics like sales revenue, inventory turnover, footfall conversion, shrinkage, and employee productivity, store owners gain the clarity needed to run leaner, more profitable operations.
If your current systems are still fragmented across spreadsheets and disconnected software, now is the time to consider a unified retail ERP solution that brings all your daily metrics into one dashboard, so you can spend less time chasing numbers and more time growing your business.
Frequently Asked Questions
1. What is the most important KPI for a retail store to track daily?
While it depends on your business type, total sales revenue combined with inventory turnover is generally considered the most critical daily metric, since it directly reflects both demand and stock efficiency.
2. How often should a retail KPI dashboard be updated?
Ideally, your dashboard should update in real time or at least once daily. Delayed data makes it harder to catch issues like stockouts, cash discrepancies, or sudden sales drops before they impact the business.
3. Can small retail stores benefit from a KPI dashboard, or is it only for large chains?
Small stores benefit just as much, if not more, since tighter margins mean small inefficiencies have a bigger relative impact. A simple retail dashboard tracking five or six core metrics can significantly improve decision making for a single-store owner.
4. What is a good inventory turnover ratio for retail businesses?
This varies by category, but generally a higher turnover ratio indicates efficient stock movement. Grocery and perishable goods typically require much higher turnover than categories like apparel or electronics.
5. How does a retail ERP system help with KPI tracking compared to spreadsheets?
A retail ERP system automatically pulls live data from your point of sale, inventory, and accounting modules into one dashboard, eliminating manual data entry errors and giving you real time visibility instead of outdated, manually compiled spreadsheet reports.